Announcing Visualizing Women in Science
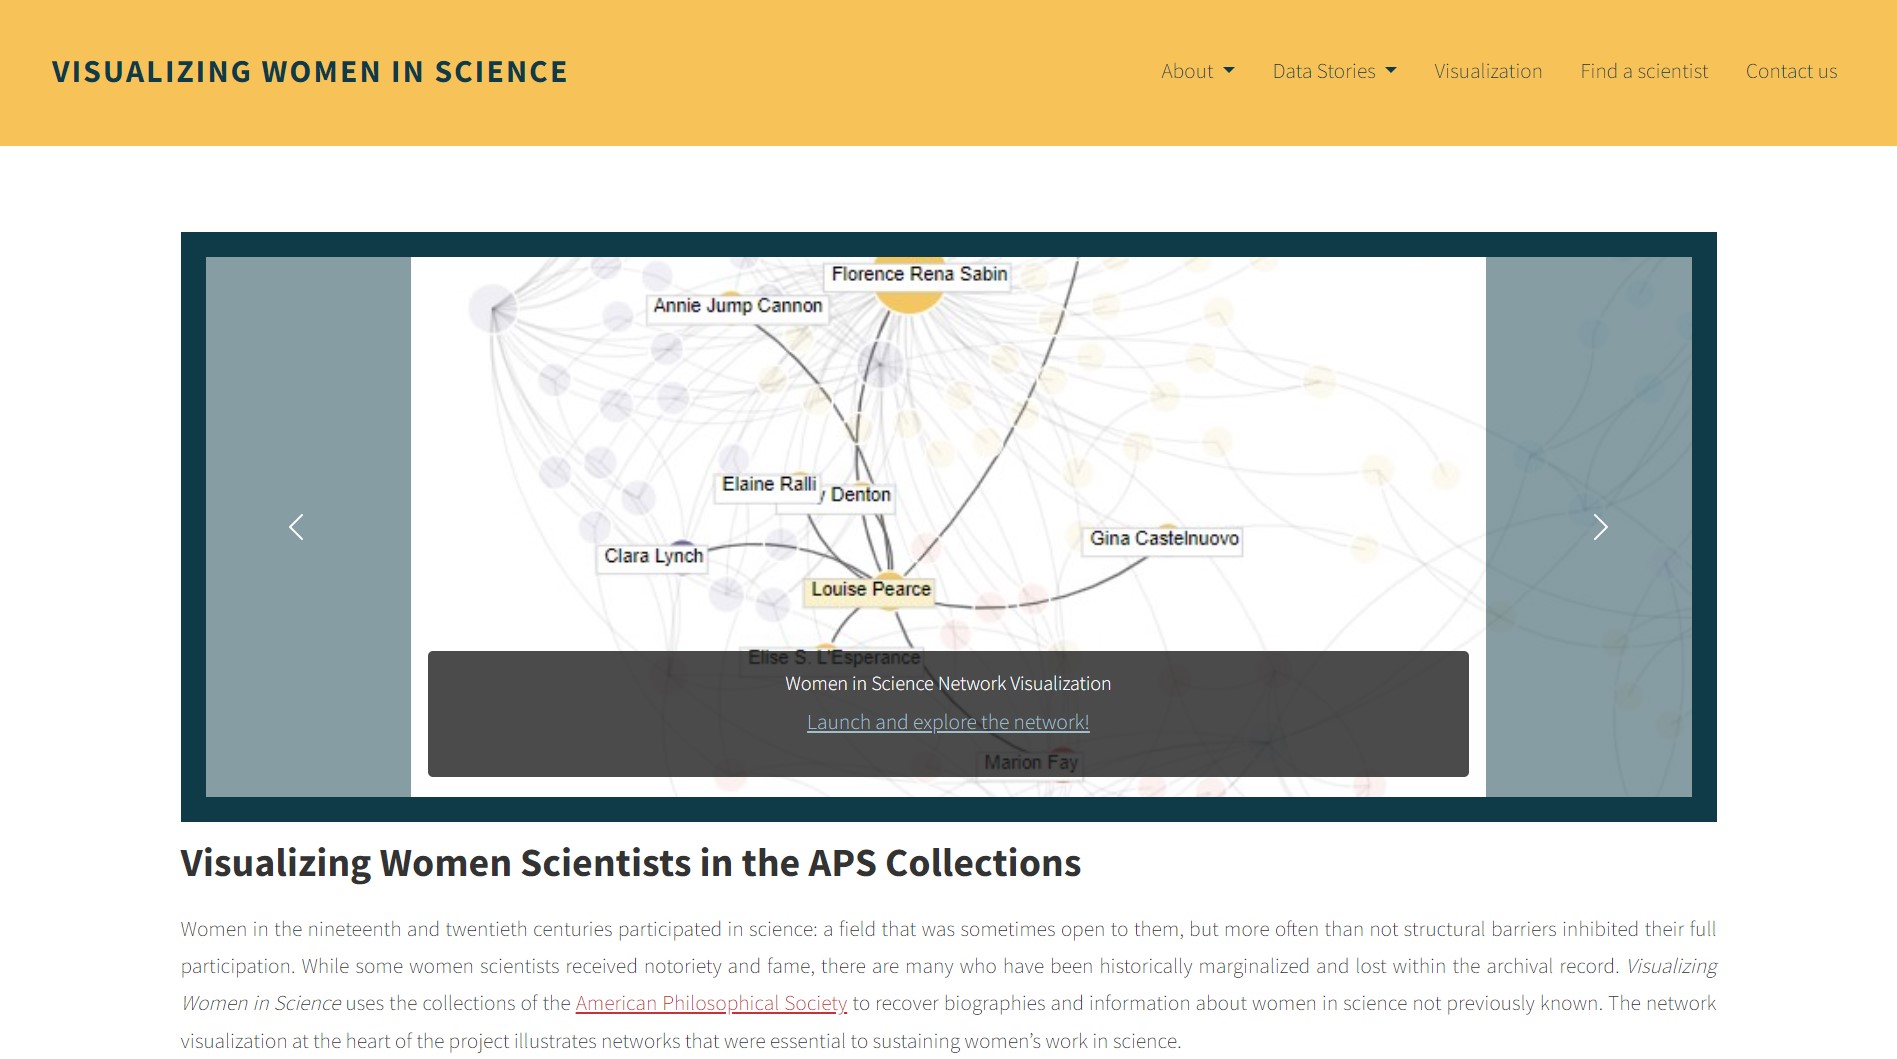
The Center for Digital Scholarship (CDS) is pleased to announce the launch of Visualizing Women in Science. This project provides a new means of exploring the collections of women scientists at the American Philosophical Society. The result of more than four years of research, Visualizing Women in Science aggregates connections between women scientists in the 20th century and provides a visual interface for exploring them.
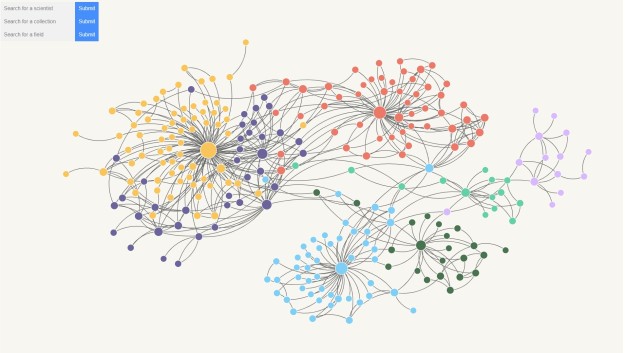
This project draws on the collections of five women scientists at the APS: Florence Rena Sabin, Florence Barbara Seibert, Barbara McClintock, Mildred Cohn, and Rose Mooney-Slater. It takes any evidence of collaboration between women scientists in these collections—correspondence, letters of recommendation, and also more casual things like name-dropping another scientist—and documents them in an interactive visualization. In the visualization, the user can click on any woman scientist and see all of the other women scientists she interacted with in the APS collections. The interface also provides short biographies of the scientists and the ability to filter by collection or discipline.

The project began in 2018 when Serenity Sutherland, Assistant Professor of Communication Studies at SUNY Oswego, received a Digital Humanities Fellowship to develop a network visualization of women scientists in the APS collections. Over the course of several visits to the APS, Sutherland surveyed the five core collections featured in the project. In addition, Digital Projects Specialist David Ragnar Nelson and Associate Director for Research, Engagement, and Technology Bayard L. Miller surveyed other history of science collections for additional connections. In all, over 60 different collections were consulted for the project.
In surveying these collections, we hope to provide a richer, more nuanced picture of women’s contributions to science. Often, we tokenize women’s involvement in science by focusing on a few famous “firsts,” such as Marie Curie, the first woman to win a Nobel Prize, or Florence Sabin, the first woman elected to the National Academy of Sciences. The papers collected at the APS largely reflect these “firsts,” but their accomplishments would not have been possible without a great number of other scientists and researchers, many of whom have been left out of the historical record.

Through the efforts of this project, we have been able to recover the stories of many women scientists. For instance, Elizabeth Eshelman Miller studied with Florence Seibert at the University of Pennsylvania, earning her Ph.D. in microbiology in 1955. Years later, in the 1980s and 1990s, Miller was still at Penn, studying cancer alongside Mildred Cohn. She forms a key link between these two much more famous researchers and helps contextualize and explain their successes.
There is also Janet Howell Clark, who was a close friend of Florence Sabin. Sabin and Clark worked tirelessly to promote women scientists through prizes and awards, and one of the women Clark nominated for an award was Barbara McClintock. Clark is not nearly as known as either Sabin or McClintock, but the network visualization helps reveal her key role in advancing the careers of women scientists. By seeing these connections, users of Visualizing Women in Science can explore the interconnections between these collections and gain a fuller picture of the history of science and the history of women’s contributions to science.
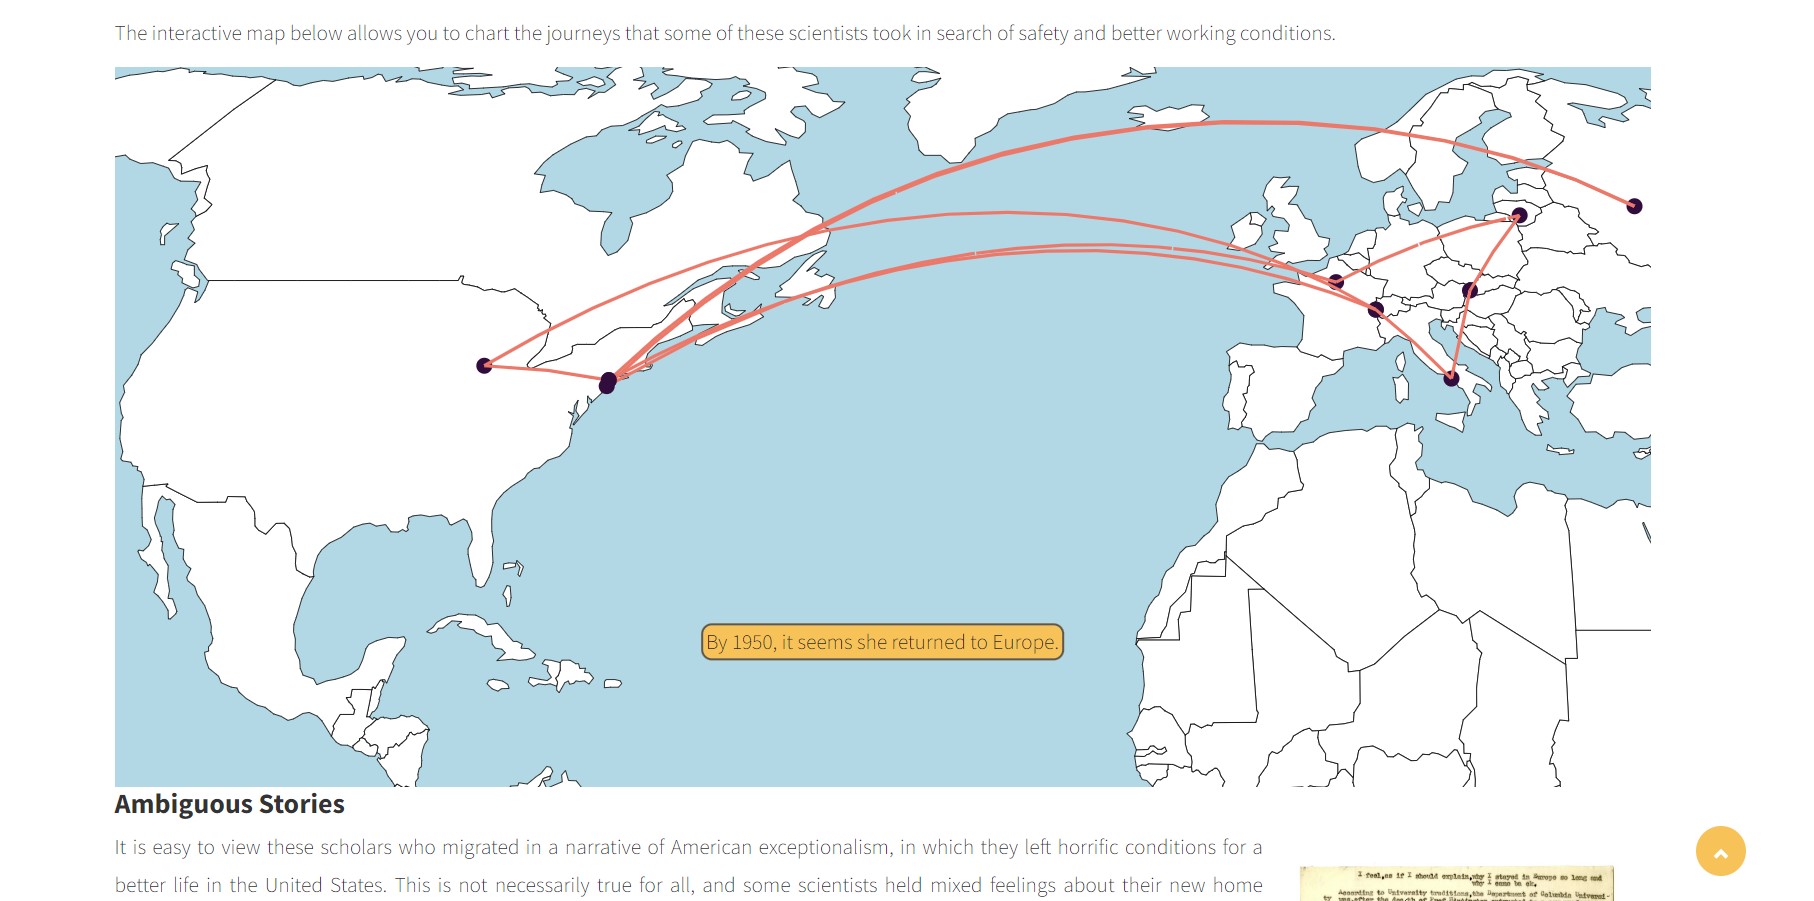
In addition to the visualization, the project features five data stories to provide additional context. One focuses on the Naples Table Association, a women-led, women-funded organization that provided research stipends and prizes for exceptional women scientists in the early 20th century. Another features excerpts from oral histories of women scientists, allowing the user to hear their challenges and successes in their own words.

Like the women featured in the project, the CDS is a collaborative department, and Visualizing Women in Science would not have been possible without the contributions of many people. Serenity Sutherland’s exhaustive search of the collections formed the basis of the network and provided the main intellectual framework for the project. David Ragnar Nelson restructured the data, wrote the code for the interface, and coauthored the data stories and website text with Sutherland. Bayard L. Miller provided support and direction throughout the project. Mackenzie Mahoney and Graziella Pierangeli wrote biographies of scientists in the network. Former Digital Projects Specialist Cynthia Heider worked on an earlier prototype of the network visualization. In addition, Mike Madeja, Patrick Spero, and Mary Grace Wahl provided invaluable feedback. We invite you to explore the project here.

